main topic interpreting results session command see also
A plant foreman chose five parts that represented the expected range of the measurements. Each part was measured by layout inspection to determine its reference (master) value. Then, one operator randomly measured each part twelve times. You obtained the process variation (16.5368) from a Gage R&R study using the ANOVA method. Minitab displays the process variation in the Session window (Total Variation row of the Study Var (6 * SD) column).
The data set used in this example has been reprinted with permission from the Measurement Systems Analysis Reference Manual (Chrysler, Ford, General Motors Supplier Quality Requirements Task Force).
1 Open the worksheet GAGELIN.MTW.
2 Choose Stat > Quality Tools > Gage Study > Gage Linearity and Bias Study.
3 In Part numbers, enter Part.
4 In Reference values, enter Master.
5 In Measurement data, enter Response.
6 In Process Variation, enter 16.5368. Click OK.
Graph window output

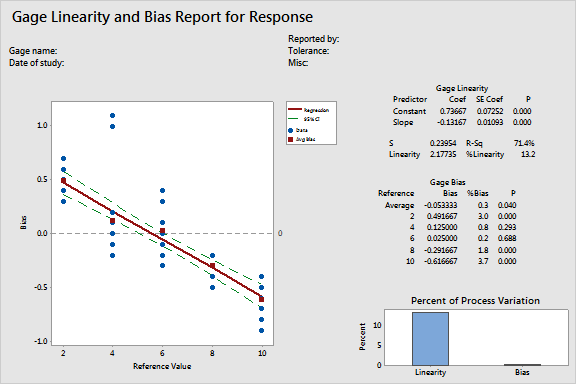
The %Linearity (absolute value of the slope * 100) is 13.2, which means that the gage linearity accounts for 13% of the overall process variation.
The %Bias for the reference average is 0.3, which means that the gage bias accounts for less than 0.3% of the overall process variation.