main topic interpreting results session command see also
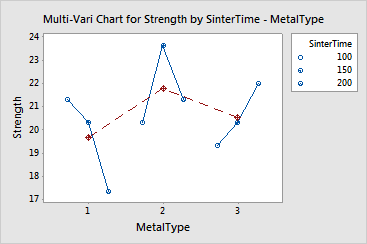
You are responsible for evaluating the effects of sintering time on the compressive strength of three different metals. Compressive strength was measured for five specimens for each metal type at each of the sintering times: 100 minutes, 150 minutes, and 200 minutes. Before you engage in a full data analysis, you want to view the data to see if there are any visible trends or interactions by creating a multi-vari chart.
1 Open the worksheet SINTER.MTW.
2 Choose Stat > Quality Tools > Multi-Vari Chart.
3 In Response, enter Strength.
4 In Factor 1, enter SinterTime. In Factor 2, enter MetalType. Click OK.
Graph window output

The multi-vari chart indicates that an interaction exists between the type of metal and the length of time it is sintered. The greatest compressive strength for Metal Type 1 is obtained by sintering for 100 minutes, for Metal Type 2 by sintering for 150 minutes, and for Metal Type 3 by sintering for 200 minutes.
To quantify this interaction, you could further analyze this data using techniques such as analysis of variance or general linear model.