main topic interpreting results session command see also
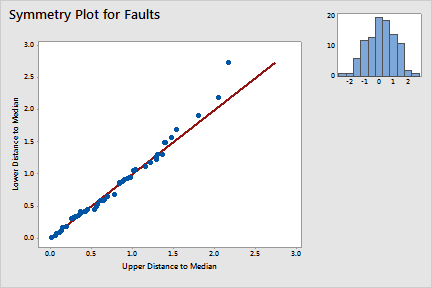
Before doing further analyses, you would like to determine whether or not the sample data come from a symmetric distribution.
1 Open the worksheet EXH_QC.MTW.
2 Choose Stat > Quality Tools > Symmetry Plot.
3 In Variables, enter Faults. Click OK.
Graph window output

Notice the few points above the line in the upper right corner. These points indicate skewness in the left tail of the distribution. You can also see this skewness in the histogram.