main topic interpreting results session command see also
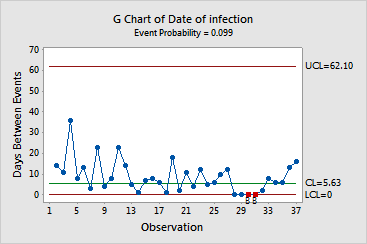
A hospital wants to monitor the number of post-surgical infections to ensure that the rate of infection remains low over time. Hospital staff record the date of each post-surgical infection. Because this data is rare event data, the staff use a G chart to track the rate of infections.
1 Open the worksheet INFECTIONS.MTW.
2 Choose Stat > Control Charts > Rare Event Charts > G.
3 From Form of Data, choose Dates of events.
4 In Variables, enter 'Date of infection'.
5 Click OK.
Session window output
G Chart of Date of infection
Test Results for G Chart of Date of infection
Benneyan Test. 3 points in a row equal to 0. Test Failed at points: 30, 31
* WARNING * If graph is updated with new data, the results above may no * longer be correct. |
Graph window output

Observations 30 and 31 failed the Benneyan test because 3 points in a row are equal to 0. The staff recorded 3 or more infections on the same day. The data analyst examines the worksheet and observes that hospital staff recorded five infections on October 26.