main topic interpreting results session command see also
In the following example, Weight contains the weight in pounds of each batch of raw material.
1 Open the worksheet EXH_QC.MTW.
2 Choose Stat > Control Charts >Time-weighted Charts > EWMA.
3 Choose All observations for a chart are in one column, then enter Weight.
4 In Subgroup sizes, enter 5. Click OK.
Session window output
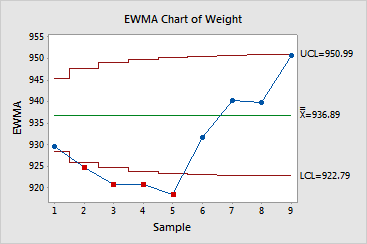
EWMA Chart of Weight
Test Results for EWMA Chart of Weight
TEST 1. One point more than 3.00 standard deviations from center line. Test Failed at points: 2, 3, 4, 5
* WARNING * If graph is updated with new data, the results above may no * longer be correct. |
Graph window output

The EWMAs for sample numbers 2, 3, 4, and 5 fall more than 3 standard deviations below the center line, suggesting small shifts away from the target.