main topic interpreting results session command see also
You are interested in the effects of a new heart drug on the heart rate, blood pressure, and weight of five elderly female patients. You measure these variables every week for three months. For FDA approval of the drug, the variables must remain in control. Therefore, you want to create a generalized variance chart to see if the joint variability is constant.
1 Open the worksheet HEARTDRUG.MTW.
2 Choose Stat > Control Charts > Multivariate Charts > Generalized Variance.
3 In Variables, enter HeartRate Systolic Diastolic Weight.
4 In Subgroup sizes, enter Week.
5 Click Labels. Under Title, enter Generalized Variance Chart for Effects of Heart Drug.
6 Click OK in each dialog box.
Graph window output
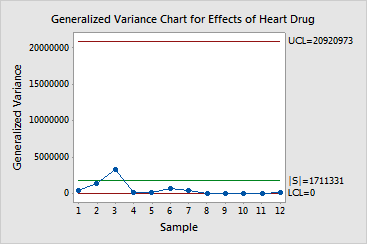
No out-of-control points appear, indicating that the joint variability of the five patients' heart rates, blood pressures, and weights is constant.