main topic interpreting results session command see also
In the following example, Weight contains the weight in pounds of each batch of raw material.
1 Open the worksheet EXH_QC.MTW.
2 Choose Stat > Control Charts > Variables Charts for Individuals > Individuals.
3 In Variables, enter Weight.
4 Click I Chart Options, then click the Tests tab.
5 Choose Perform all tests for special causes, then click OK in each dialog box.
Session window output
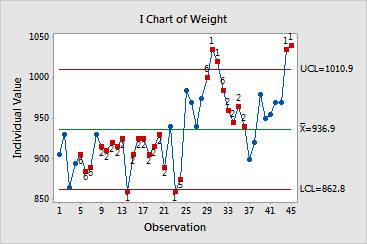
I Chart of Weight
Test Results for I Chart of Weight
TEST 1. One point more than 3.00 standard deviations from center line. Test Failed at points: 14, 23, 30, 31, 44, 45
TEST 2. 9 points in a row on same side of center line. Test Failed at points: 9, 10, 11, 12, 13, 14, 15, 16, 17, 18, 19, 20, 21, 33, 34, 35, 36
TEST 5. 2 out of 3 points more than 2 standard deviations from center line (on one side of CL). Test Failed at points: 24, 30, 31, 45
TEST 6. 4 out of 5 points more than 1 standard deviation from center line (on one side of CL). Test Failed at points: 5, 6, 7, 29, 30, 31, 32, 45
* WARNING * If graph is updated with new data, the results above may no * longer be correct. |
Graph window output

The individuals chart shows six points outside the control limits and 22 points inside the control limits exhibiting a nonrandom pattern, suggesting the presence of special causes. See the Session window results for a list of the points that failed each test.