main topic interpreting results session command see also
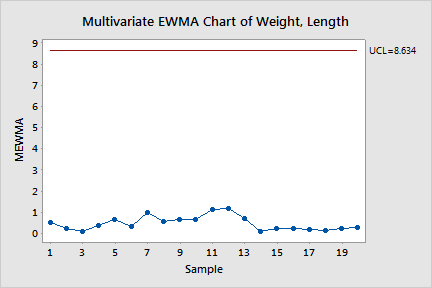
As production manager of a toy manufacturing company, you want to monitor the weight (in grams) and length (in centimeters) of one of your toy parts. You collect 4 samples each day for 20 days. Because weight and length are correlated and you want to detect small shifts in these variables, you create a multivariate EWMA chart.
1 Open the worksheet TOYS.MTW.
2 Choose Stat > Control Charts > Multivariate Charts > Multivariate EWMA.
3 In Variables, enter Weight Length.
4 In Subgroup sizes, enter Day. Click OK.
Graph window output

All points fall below the upper control limit, indicating that differences in weight and length over time are due to common causes.