main topic interpreting results session command see also
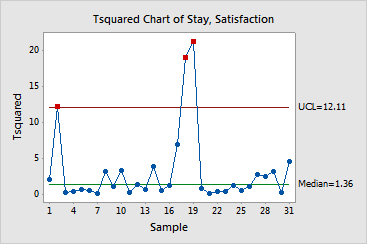
You are a hospital manager interested in monitoring patient satisfaction ratings through the month of January. You randomly ask 5 patients each day to complete a short questionnaire about their stay at the hospital before they check out. Because satisfaction and length of stay are correlated, you create a T2 chart to simultaneously monitor satisfactions ratings (on scale of 1-7) and length of stay (in days).
1 Open the worksheet HOSPITAL.MTW.
2 Choose Stat > Control Charts > Multivariate Charts > Tsquared.
3 In Variables, enter Stay Satisfaction.
4 In Subgroup sizes, enter Departure, then click OK.
Session window output
Tsquared Chart of Stay, Satisfaction
Test Results for Tsquared Chart of Stay, Satisfaction
Point Variable P-Value Greater Than UCL 2 Stay 0.0030 Satisfaction 0.0067 18 Stay 0.0010 Satisfaction 0.0002 19 Satisfaction 0.0000
* WARNING * If graph is updated with new data, the results above may no * longer be correct. |
Graph window output

Two points are out of control: January 18 and 19. The Session window results indicate that each variable contributes significantly to January 18. However, Satisfaction is the only variable that is out of control for January 19. You should investigate what special causes - perhaps hospital heating problems or interrupted food service - may have affected length of stay and satisfaction rating for those 2 days.