main topic interpreting results session command see also
Suppose you work in a paper manufacturing plant and are concerned about quality improvement. Because your process makes paper in short runs, you need to employ standardized control charting techniques to assess quality. You know that the variation in your process is proportional to the thickness of the paper being produced, so you plan to use the Relative to size (combine all observations, use ln) option to estimate s.
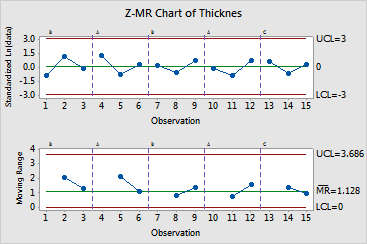
You collect data from five runs including three different grades of paper. You then produce a Z-MR chart for the individual observations (Z) and the moving ranges (MR) from your short run paper-making process.
1 Open the worksheet EXH_QC.MTW.
2 Choose Stat > Control Charts > Variables Charts for Individuals > Z-MR.
3 In Variables, enter Thicknes. In Part indicator, enter Grade.
4 Click Z-MR Options, then click the Estimate tab.
5 Under How to define groups of observations, choose Relative to size (combine all observations, use ln).
6 Click OK in each dialog box.
Graph window output

All points are in control for all five runs for both the process means and moving ranges, suggesting that only common causes affect the paper making process.