main topic interpreting results session command see also
You work in a manufacturing plant concerned about quality improvement. You decide to measure the length of 10 sets of cylinders produced during each of five shifts, for a total of 50 samples daily. Because a zone control chart is very easy to interpret, you decide to evaluate your data with it. You also decide to reset the cumulative score following each out-of-control signal.
1 Open worksheet EXH_QC.MTW.
2 Choose Stat > Control Charts > Variables Charts for Subgroups > Zone.
3 Choose All observations for a chart are in one column, then enter Length.
4 In Subgroup sizes, enter 5.
5 Click Zone Options, then click the Weights/Reset tab.
6 Check Reset cumulative score after each signal. Click OK in each dialog box.
Session window output
Zone Chart of Length
Test Results for Zone Chart of Length
TEST. Cumulative score greater than or equal to zone 4 score. Test Failed at points: 6, 10
* WARNING * If graph is updated with new data, the results above may no * longer be correct. |
Graph window output
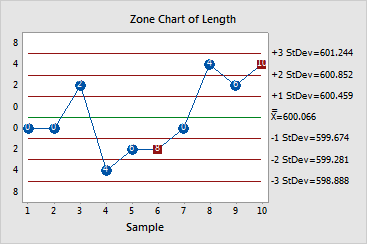
The cumulative score at subgroup 6 equals eight, which indicates the process is out of control. You find that the operator reset the machine following subgroup 6, as he believed the machine was slipping. However, the zone chart detects the process is out of control again at subgroup 10. After seeing the subsequent rise in subgroups 7-10 on the zone chart, you decide the operator may have overcompensated for the problem identified at subgroup 6.