Upper control limit
Lower control limit
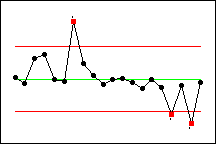
Horizontal lines located above and below the center line that are used to judge whether a process is out of control. The upper and lower control limits are based on the expected random variation in the process.
|
|
Upper control limit
Lower control limit
|
Use the control limits to determine if any subgroups behave differently than expected. For example, the above Xbar chart displays the weight of subgroups of spaghetti cans over time. One point is above the upper control limit, indicating the subgroup of cans has a larger weight than expected. Two points are below the lower control limit, indicating that those subgroups of cans have a smaller weight than expected.
By default, Minitab's control limits are displayed 3 standard deviations above and below the center line.
Do not confuse control limits with specification limits, which are usually based on customer requirements and indicate the desired amount of variation you want to see in the process. Control limits display the actual amount of variation based on the sample data. A process can be in control and yet not be capable of meeting specifications.