Cpm
An overall capability index that measures whether the process meets
specification and is on target. Cpm compares the specification spread
to the spread of your data, taking into account the data's deviation from
the target value instead of its deviation from the process mean. Large
distances between the target and your observations result in a small Cpm
value. As your process improves and approaches the target, the value of
the Cpm index increases.
Compare your Cpm value to a benchmark value to determine whether to
improve your process; many industries use a benchmark value of 1.33. If
the values of your index are less than the benchmark value, you must take
steps to improve your process.
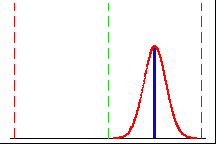
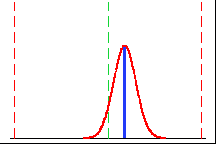
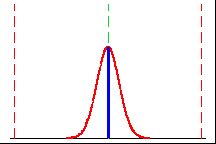
The middle vertical line is the target value. The right and left vertical
lines are the upper and lower specification limits.
|

|
This process spread falls within the specification limits, but it is
not on target. This process will have a poor Cpm value. |
|

|
This process spread falls within specification limits but not on target.
But it is closer to the target than the above graph, so its Cpm value
is better. |
|

|
This process spread is within the specification limits and on target.
This process has the greatest Cpm value. |
If the process is exactly centered on target, the Ppk and Cpm values
will be equal. Cpm is calculated only when you provide the target value.


