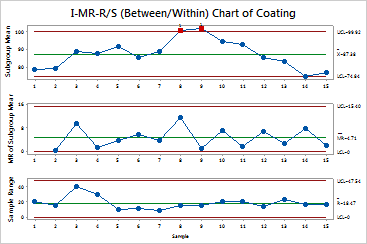
Plots between-subgroup and within-subgroup variation for variables data. This chart consists of an individuals chart, a moving range chart, and a R or S chart.
Use I-MR-R/S charts when you want to assess the variation within and across subgroups. For example, you are a manufacturer of steel beams that are used in building construction. Each beam is coated with an anti-corrosion treatment. You are monitor coating thickness across the length of the beam using an I-MR-R/S chart because you are interested in the variation within a beam and across beams. You take 3 samples from 15 beams and measure coating weight.
The moving range charts shows that between-subgroup variation is in control, and the R chart shows that within-subgroup variation is in control. However, the individuals chart has two points above the upper control limit, suggesting that the process is out-of-control.
