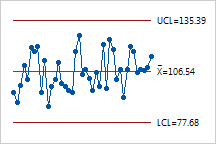
The points vary randomly around the center line and are within the control limits. No trends or patterns are shown. The amount of time to perform hernia surgery is stable.
Plots individual observations over time for variables data. Use this chart to monitor the process center when it is difficult or impossible to group measurements into subgroups. This occurs when measurements are expensive, production volume is low, or products have a long cycle time. The Individuals chart is also known as the I chart.
Consider the below Individuals chart. A hospital wants to track whether the amount of time to perform outpatient hernia surgery is stable over 2 weeks.
|
|
The points vary randomly around the center line and are within the control limits. No trends or patterns are shown. The amount of time to perform hernia surgery is stable.
|