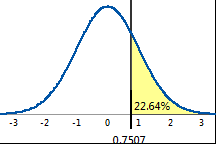
Standard Normal Density Curve

A process with an Average P of 0.2264 has a Process Z of 0.7507.
Describes the capability of a binary process
For example, a company manufactures hydraulic pistons and inspects them for cracks. Pistons with cracks are labeled defective and scrapped. Inspectors examine 10 subgroups of pistons and observe the average percent of defective pistons equals 22.64%. This percentage corresponds to an Average P of 0.2264. The point on the standard normal curve with an area of 0.2264 to its right is 0.7507. This value is the Process Z, and represents a poorly performing process. This company needs to improve its manufacturing process.
|
Standard Normal Density Curve |
|
|
|
A process with an Average P of 0.2264 has a Process Z of 0.7507. |
|
|
|