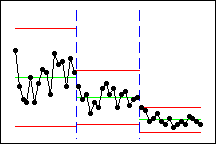
This historical chart shows three stages of a process, which represent before, during, and after the implementation of a new procedure. With stages, you can see that the process mean (centerline) and expected variation in the process (area between the upper and lower control limit) decrease over time.