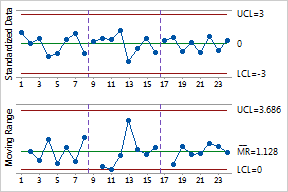
The standardized values for Run B seem to vary more than those for Run A and Run C. On the MR chart, one point is located near the lower control limit while another is unusually high. The process may be influenced by special causes.
Plots the standardized process mean (Z chart) and variation (MR chart) for short run processes when little data are available. Short run processes often do not have enough data in each run to produce good estimates of the process parameters. For example, you may produce only 20 units of a part, then reset the machine to produce a different part in the next run.
Consider the Z-MR chart below. A manufacturer wants to assess the performance of its metal stamping process. Part measurements were taken from three runs.
|
|
The standardized values for Run B seem to vary more than those for Run A and Run C. On the MR chart, one point is located near the lower control limit while another is unusually high. The process may be influenced by special causes. |
The Z-MR Chart standardizes the measurement data by subtracting the mean to center the data, then dividing by the standard deviation. Standardizing allows you to evaluate data from different runs by interpreting a single control chart.