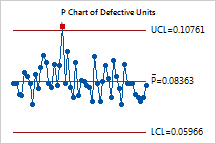

P Chart and Laney P' Chart
Plot the fraction rejected as nonconforming.
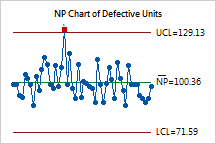
NP Chart
Plots the number rejected as nonconforming.
Control charts that plot nonconformities (defects) or nonconforming units (defectives). A nonconformity refers to a quality characteristic and nonconforming refers to the overall product. For example, a scratch on a metal panel is a nonconformity. If several scratches or any deep scratches exist, the entire panel may be considered nonconforming. Because a unit may have many quality characteristics, it may have many nonconformities, but the unit itself is either conforming or nonconforming.
Minitab offers six attribute charts. For nonconforming items (defectives), use a P chart, Laney P' chart, or NP chart. For nonconformities (defects), use a U chart, Laney U' chart, or C chart.
|
|
|
|
P Chart and Laney P' Chart Plot the fraction rejected as nonconforming. |
NP Chart Plots the number rejected as nonconforming. |
|
|
|
|
U Chart and Laney U' Chart Plot the number of nonconformities found in a unit. |
C Chart Plots the number of nonconformities found in a subgroup. |