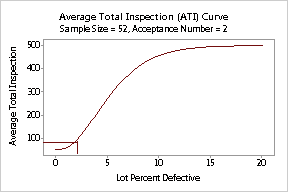
Average total inspection (ATI)
curve
Approximates the relationship between the quality of the incoming material
and the number of items that need to be inspected, assuming that rejected
lots will be 100% inspected and defective items will be reworked and inspected
again (rectifying inspection).
The average total inspection per lot depends on the incoming quality,
the probability that the lot will be accepted, and the sample and lot
sizes.
|
|
For example, your sampling plan specifies that you sample 52 rollers
from a shipment of 500. If the actual % defective is 1.5%, the average
total inspected per lot is 71.398 rollers.
By plotting the ATI
curve, the average inspection levels are evident. |
When incoming quality is very good, for example, no defects, then you
inspect the specified sample size. When the incoming quality is very bad,
for example, all defects, then you resort to 100% inspection. Normally
the quality levels falls somewhere in between, so the average number inspected
across many lots also falls in between 0% and 100% of the lot size.
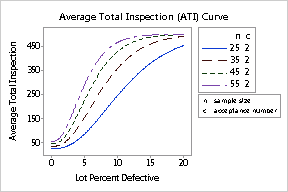
You can also compare ATI
curves to help choose the appropriate sampling plan.
|
|
In this case, the shift supervisor thinks sampling 52 rollers from 500
is too much. You can develop curves for various sample sizes and acceptance
numbers to illustrate the effect on the average total number of inspected
items.
|
Look at OC
curves, AOQ
curves, and ATI
curves together when your corrective action for rejected lots is 100%
inspection.