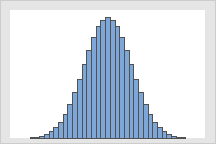
One of the properties of a binomial distribution is that when n is large and p is close to 0.5, the binomial distribution can be approximated by the standard normal distribution. For this graph, n = 100 and p = 0.5.
Used to describe a process where the outcomes can be labeled as an event or nonevent if, for example, an item passes or fails inspection or a political party wins or loses. Often used in quality control, public opinion surveys, medical research, and insurance.
The number of events (X) in n trials follows a binomial distribution if the following conditions are met:
The binomial distribution is used when you are interested in the occurrence of an event and not in its magnitude. For example, you are interested in the number of defective items and not the degree of the defectiveness. Suppose a process produces 2% defective items. You are interested in knowing how likely is it to get 3 or more defective items in a random sample of 25 items selected from the process. The number of defective items (X) follows a binomial distribution with n = 25 and p = 0.02.
|
|
One of the properties of a binomial distribution is that when n is large and p is close to 0.5, the binomial distribution can be approximated by the standard normal distribution. For this graph, n = 100 and p = 0.5. |