Process capability for rope width
Minitab's Capability Sixpack allows you to assess the capability of a process at a glance by combining the following quality tools into a single display:
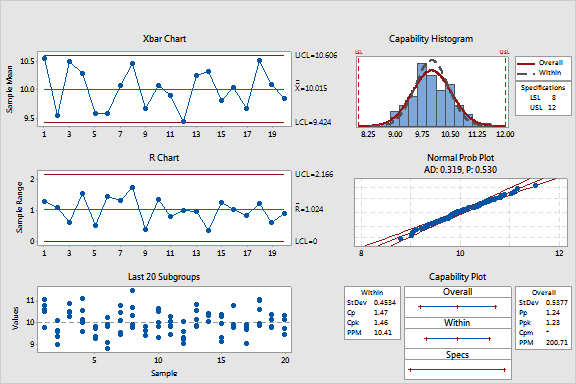
For example, your company weaves rope that is 10mm is width. You want to study the capability of the weaving process, so you collect twenty subgroups of rope, each containing five pieces, and use the Capability Sixpack to analyze the data. The probability plot indicates that the assumption of population normality is reasonable. The R chart and a Cp index greater than the reference value of 1.33 suggest stability of subgroup variation and indicate that the within-subgroup variation of your process is acceptable. However, the Pp index is less than the reference value of 1.33, so the overall capability of this process is inadequate due to variation between subgroups. The Xbar Chart and plot of the last 20 subgroups also depict this variation. This process needs improvement.
|
Process capability for rope width |
|
|
Minitab offers the Capability Sixpack for normal, nonnormal, and between/within analysis.