Cp and Pp
Capability indices that measure whether a process is capable of meeting
specifications by calculating a ratio between the specification spread
and the process spread. In general, the higher your Cp and Pp values,
the more capable your process. To calculate Cp and Pp, you must know both
the upper and lower specification limits.
Cp indices recognize the fact that your samples represent rational subgroups,
which indicate how the process would perform if the shift and drift between
subgroups could be eliminated. Therefore, it calculates process spread
using within-subgroup variation.
Pp, on the other hand, ignores subgroups and considers the overall variation
of the entire process. This overall variation accounts for the shift and
drift that can occur between subgroups; therefore, it is useful in measuring
capability over time. If your Pp value differs greatly from your Cp value,
you conclude that there is significant variation from one subgroup to
another.
Compare your Cp and Pp values to benchmark values to determine whether
to improve your process; many industries use benchmark values of 1.33.
If the values of your indices are less than the benchmark values, you
must take steps to improve your process.
For example, a butter manufacturer uses an automatic filling machine
to make 500 gm containers of butter. The manager wants to ensure that
the filling process meets specifications of 498 gm to 502 gm of butter
in each container. To assess the capability of this process, the manager
randomly collects and weighs five containers per day for twenty days:
each day's collection is a subgroup for this analysis. Further inspection
reveals a leak in the machine, so the manager fixes this problem and collects
another twenty subgroups of 5 containers after the improvement takes effect.
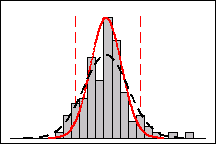
The following graphs illustrate Cp and Pp values of this filling process
before and after improvement.
|
Cp = 0.70, Pp = 0.48 |
|
|

|
Prior to process improvement, the process spread is greater
than the specification spread. In other words, too many containers weigh
more than 502 gm or less than 498gm. This process has low Cp and Pp values
and needs improvement. |
|
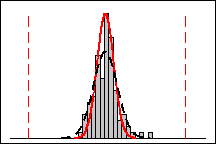
Cp = 3.14, Pp = 2.18 |
|
|

|
After the process improvement, the manager collects new
data and observes that the specification spread is greater than the process
spread. The high values of Cp and Pp show that the process is now meeting
specifications. |
A disadvantage of the Cp and Pp indices is that they compare only the
process spread with the specification spread, but not their locations.
In other words, they do not describe how far the process is running from
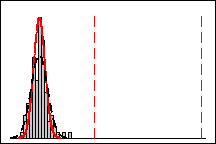
the target region. For example, both processes below have the same Cp
and Pp values, although one is clearly not capable. To
avoid mistakes, use graphs in combination with other capability indices
(such as Cpk, Ppk, etc.) to draw meaningful conclusions from your data.
|
Cp = 3.14, Pp = 2.18 |
Cp = 3.14, Pp = 2.18 |
|

|

|


