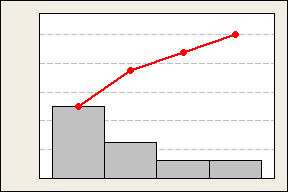
From left to right, the four bars in this Pareto chart represent 51, 25, 12, and 12% of their total number. The red line marks the cumulative percentage of each subsequent bar: 51%, 76%, 88%, and 100%.
The sum of all the percentage values up to that category, as opposed to the individual percentages of each category.
|
|
From left to right, the four bars in this Pareto chart represent 51, 25, 12, and 12% of their total number. The red line marks the cumulative percentage of each subsequent bar: 51%, 76%, 88%, and 100%. |