CUSUM chart
A type of time-weighted control chart that displays the cumulative sums
(CUSUMs) of the deviations of each sample value from the target value.
Because
it is cumulative, even minor drifting in the process mean will lead to
steadily increasing (or decreasing) cumulative deviation values. Therefore,
this chart is especially useful in detecting processes that are slowly
slipping away from the target value due to machine wear, calibration issues,
etc. The points on the CUSUM chart should fluctuate randomly around zero.
If a trend develops upwards or downwards, it should be considered as evidence
that the process mean has shifted, and you should look for special causes.
Minitab generates two kinds of CUSUMs:
· Two
one-sided CUSUMs (the default). The upper CUSUM detects upward shifts
in the level of the process and the lower CUSUM detects downward shifts.
This chart uses control limits (UCL and LCL) to determine when an out-of-control
situation has occurred.
· One
two-sided CUSUM. This chart uses a V-mask, rather than control limits,
to determine when an out-of-control situation has occurred. The V-mask
standardizes the deviations from the target value, and plots the deviations
from this value.
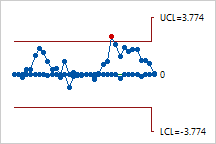
For example, a manufacturer of centrifuge rotors wants to track the
diameter of all rotors produced during a week. The diameters must be close
to the target because even small shifts cause problems. The following
CUSUM chart (two one-sided CUSUMs) resulted.
|
CUSUM Chart |
|
|
|
The points appear to vary randomly around the center line and are within
the control limits, with the exception of one point. No trends or patterns
are shown. The variability in the rotor diameter appears to be stable,
but the out-of-control point should be investigated.
|
The plot points can be based on either subgroups or individual observations.
When data are in subgroups, the mean of all the observations in each subgroup
is calculated. CUSUM statistics are then formed from these means. When
you have individual observations, CUSUM statistics are formed from the
individual observations.