Data transformation
Many analyses require an assumption of normality. In cases when your
data are not normal, sometimes you can apply a function to make your data
approximately normal so that you can complete your analysis.
For example, suppose you would like to perform a capability analysis
on the time required to deliver pizzas. Knowing that there is some minimum
time (lower bound), but probably no maximum time (upper bound), your data
probably will skew to the right.
|

|

|
|
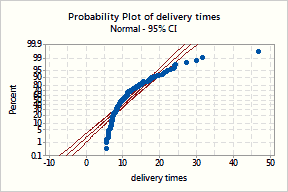
Pizza delivery times are right skewed and don't appear normally distributed. |
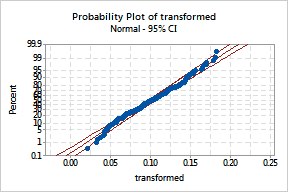
Take the reciprocal to make the data more normal. The reciprocal is
obtained by using the equation of Y = 1/X. So the transformed data = 1
/ delivery time. The probability plot shows the transformed data much
more closely following a normal distribution. |
Depending on your data, there are many different functions such as square
root, logarithm, power, reciprocal or arcsine, that you could apply to
transform your data. When you aren't sure which transformation to try,
Minitab can help.
Minitab provides two methods for transforming your data:
· Box-Cox
transformation - Minitab simply finds an optimal power transformation.
(W = Y**Lambda, where Minitab finds the best value for lambda). Although
the best estimate of lambda could be any number between -5 and 5, in any
practical situation you want a lambda value that corresponds to an understandable
transformation, such as the square root (a lambda of 0.5) or the natural
log (a lambda of 0).
The Box-Cox transformation is easy to understand, but
is very limited and often does not find a suitable transformation. It
is also only available for data that are positive.
· Johnson
transformation - The Johnson transformation uses a different algorithm
than the Box-Cox transformation. The Johnson transformation function is
selected from three families of functions in the Johnson system. Because
the functions cover a wide variety of distributions by changing the parameters,
Minitab usually finds an acceptable transformation. The family Minitab
selects is called the Best Transformation Type.
If the Box-Cox algorithm does not find a suitable transformation,
then try the Johnson transformation (or assume that your data follows
a non-normal distribution and use another distribution instead of transforming
the data). The Johnson transformation function is more complicated, but
is very powerful for finding an appropriate transformation.
|
Note |
The Box-Cox transformation utilizes the fact that the
data are in subgroups (when subgroups > 1); the Johnson transformation
does not. That's why the "within subgroup" analysis is only
available using the Box-Cox transformation. |

