EWMA Chart

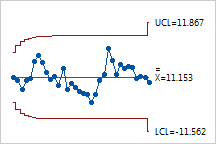
The points appear to vary randomly around the center line and are within the control limits. No trends or patterns are shown. The variability in the rotor diameter appears stable.
A type of time-weighted control chart that plots the exponentially weighted moving averages. Each EWMA point incorporates information from all the previous subgroups or observations based on a user-defined weighting factor. An advantage of EWMA charts is that they are not greatly influenced when a small or large value enters the calculation. By changing the weight used and the number of s's for the control limits, you can construct a chart that can detect almost any size shift in the process. Because of this, they are often used to monitor in-control processes for detecting small shifts away from the target.
For example, a manufacturer of centrifuge rotors wants to track the diameter of all rotors produced during a week. The diameters must be close to the target because even small shifts cause problems. The following EWMA chart resulted:
|
EWMA Chart |
|
|
|
The points appear to vary randomly around the center line and are within the control limits. No trends or patterns are shown. The variability in the rotor diameter appears stable.
|
The plot points can be based on either subgroups or individual observations. When data are in subgroups, the mean of all the observations in each subgroup is calculated. Exponentially weighted moving averages are then formed from these means. When you have individual observations, exponentially weighted moving averages are formed from the individual observations.