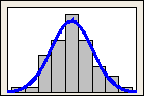
A graph used to assess the shape and spread of continuous sample data. You might create a histogram prior to or in conjunction with an analysis to help confirm assumptions and guide further analysis.
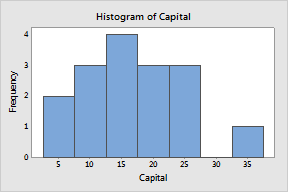
To draw a histogram Minitab divides sample values into many intervals called bins. By default, bars represent the number of observations falling within each bin (its frequency). In the histogram below, for example, there is one observation between one and two, four observations with values between two and three, and so on. Minitab automatically determines an optimal number of bins, but you can edit the number of bins as well as the intervals covered by each.
Here are some of the questions a histogram can help you answer:
|
Shape |
|
|
|
|
|
Do the data appear to be normally distributed? |
Do they skew left or right? |
|
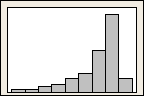
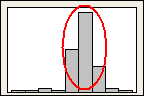
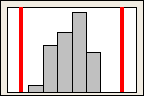
Spread |
|
|
|
|
|
Are the data tightly clustered about a certain value? |
Do the data stay within set limits?
|