Normal distribution with Johnson transformation
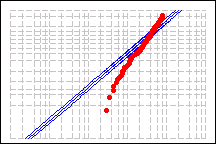
Exponential distribution
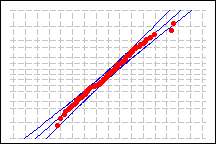
Anderson-Darling statistic = 0.231
p-value = 0.799
Anderson-Darling statistic = 5.982
p-value < 0.003
A Minitab tool to identify which distributions can be used to fit your data based on probability plots and goodness-of-fit statistics. Knowing the distribution of your data is essential when choosing a statistical method. Use Minitab's Individual Distribution Identification to:
Minitab performs goodness-of-fit tests on your data for a variety of distributions and estimates their parameters. Choose the distribution that best fits your data, and is most appropriate for your analysis.
For example, you collect data on the extent of warping in ceramic tiles. The data distribution is unknown, so you perform Individual distribution identification on the data to compare goodness-of-fit between the exponential distribution and the normal distribution after a Johnson transformation. The probability plots below indicate that the exponential distribution provides very poor goodness-of-fit; the p-value is low enough to reject the null hypothesis that your data follow an exponential distribution. However, after applying a Johnson transformation, your data closely follow a normal distribution because the p-value is large and almost all data points fall within the confidence bounds of the normal probability plot. Of these two distributions, the normal distribution with a Johnson transformation provides the better fit for your data.
|
Normal distribution with Johnson transformation |
Exponential distribution |
|
|
|
|
Anderson-Darling statistic = 0.231 p-value = 0.799 |
Anderson-Darling statistic = 5.982 p-value < 0.003 |