Multivariate control charts
A type of variables control chart that shows how correlated, or dependent,
variables jointly influence a process or outcome. For example, you can
use a multivariate control chart to investigate if temperature and pressure
are jointly in control in the production of injection-molded plastic parts.
To minimize type 1 error, you should use a multivariate chart when variables
are correlated instead of several control charts, each plotting a single
variable, because each control chart has a type 1 error risk that accumulates
with the number of charts. Plus, multivariate charts can be easier to
interpret than several single control charts because a single control
limit determines whether the process is in control.
Minitab offers four multivariate control charts:
|
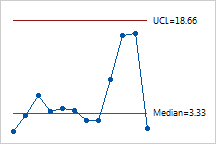
Tsquared chart |
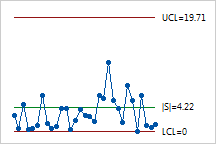
Generalized variance chart |
|

|

|
|
A chart of that uses a special statistic (Hotelling's T2)
combining dispersion and mean information from several variables. |
A chart that simultaneously monitors the process variability of two
or more related process characteristics. |
|
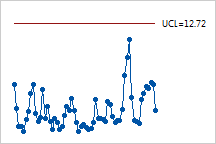
Multivariate EWMA chart |
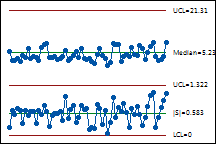
TSquared generalized variance chart |
|

|

|
|
A multivariate chart of exponentially weighted moving averages. Use
to simultaneously
monitor two or more related process characteristics. |
A TSquared
chart (top) and generalized Variance chart (bottom) displayed in one window.
Use to simultaneously assess whether the process mean and variation are
in control. |
One drawback to multivariate charts, however, is that the scale on multivariate
charts is unrelated to the scale of any of the variables, and out-of-control
signals do not reveal which variable (or combination of variables) caused
the signal.


