Normal distribution
A bell-shaped curve that is symmetric about its mean. The normal distribution
is the most common statistical distribution because approximate normality
arises naturally in many physical, biological, and social measurement
situations. Many statistical analyses require that the data come from
normally distributed populations. The normal distribution is also known
as the Gaussian distribution.
For example, the heights of all adult males residing in the state of
Pennsylvania are approximately normally distributed. Therefore, the heights
of most men will be close to the mean height of 69 inches. A similar number
of men will be just taller and just shorter than 69 inches. Only a few
will be much taller or much shorter.
The mean (μ) and the standard deviation (σ) are the two parameters
that define the normal distribution. The mean is the peak or center of
the bell-shaped curve. The standard deviation determines the spread in
the data. Approximately, 68% of observations are within +/- 1 standard
deviation of the mean; 95% are within +/- 2 standards deviations of the
mean; and 99% are within +/- 3 standard deviations of the mean.
For the height of men in Pennsylvania, the mean height is 69 inches
and the standard deviation is 2.5 inches.
|

|
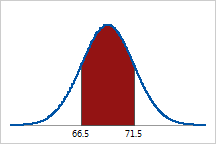
Approximately 68% of Pennsylvania men are between 66.5 (m
- 1s) and 71.5 (m + 1s) inches tall. |
|

|
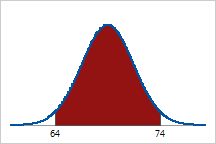
Approximately 95% of Pennsylvania men are between 64 (m
- 2s) and 74 (m +
2s) inches tall. |
|

|
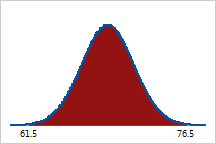
Approximately 99% of Pennsylvania men are between 61.5 (m
- 3s) and 76.5 (m + 3s) inches tall.
|


