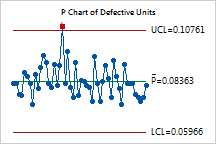
P Chart: On average, 8% of the delivery vehicles are out for repair on any given day. You can expect between 5.96% and 10.76% of vehicles to be non-operational each day.
Plots the fraction, percent, or proportion of nonconforming units. The P chart is the most widely used attributes control chart.
While each unit may have many quality characteristics that can be evaluated, the unit itself is always considered as either conforming or nonconforming. For example, use to examine whether wait times are less than 5 minutes, flights depart on time, bicycle tires are flat, printed logos are smudged, and so on.
A delivery service has 1200 vehicles in their fleet. On any given day, each vehicle is either operational or is down for maintenance. Over 2 months time, you have collected the data on the number of vehicles that are down for repair.
The following P chart plots the proportion of vehicles that are down for repair each day.
|
|
P Chart: On average, 8% of the delivery vehicles are out for repair on any given day. You can expect between 5.96% and 10.76% of vehicles to be non-operational each day. |
Another chart that plots defectives is the NP chart. However, the NP chart plots the number rejected as nonconforming.