Test for special causes

Nelson tests for special causes - each of the tests for special causes, shown below, detects a specific pattern in the data plotted on the chart. The occurrence of a pattern suggests a special cause for the variation, one that should be investigated.

For example, suppose you monitor the level in your cooling tanks with control charts. You see that the 7th plotted point fails test 1 by exceeding the control limits. You should investigate your process to determine what happened during this time.

Eight Tests for Special Causes

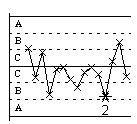
Test 1    1 point more than 3s from center line

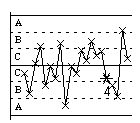
Test 2    9 points in a row on same side of center line
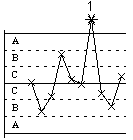
image\QCTEST1.gif

image\QCTEST2.gif

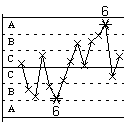
Test 3    Six points in a row, all increasing or all decreasing

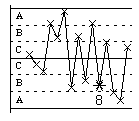
Test 4    Fourteen points in a row, alternating up and down
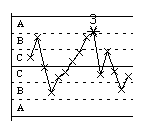
image\QCTEST3.gif

image\QCTEST4.gif

Test 5    2 out of 3 points > 2s from center line (same side)

Test 6    4 out of 5 points > 1s from center line (same side)
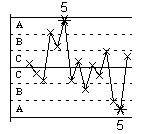
image\QCTEST5.gif

image\QCTEST6.gif

Test 7    15 points in a row within 1s of center line (either side)

Test 8    8 points in a row > 1s from center line (either side)
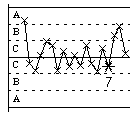
image\QCTEST7.gif

image\QCTEST8.gif

The Western Electric decision rules are also commonly used to test for special causes.

Note

The following variables charts can detect all eight tests:

X and R, X and S, X, Individuals, I-MR-R/S, I-MR, T, Capability Sixpack (Normal), and Capability Sixpack (Between/Within).

The R, S, Moving Range, and G Charts, as well as the attribute control charts, can detect the first four tests.