T2 generalized variance chart
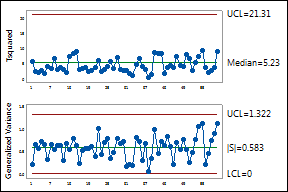
The points vary randomly around the center line and are within the control limits for both charts. No trends or patterns are shown. The strength of the plastic product is stable across the 20 subgroups.
Plots the process location (Tsquared chart) and the process variability (generalized variance chart) of two or more related process characteristics over time. It is the multivariate counterpart to the Xbar-R, Xbar-S, and I-MR charts. You can use this chart to simultaneously assess whether the process mean and variation are in control.
The charts are displayed together because you should interpret both charts to determine if your process is stable. Examine the generalized variance chart first. The process variation must be in control to correctly interpret the Tsquared chart because the control limits of the Tsquared chart are calculated considering both process spread and center.
For example, use a Tsquared generalized variance chart to monitor temperature and pressure in a plastic injection-molding process.
|
T2 generalized variance chart |
|
|
|
The points vary randomly around the center line and are within the control limits for both charts. No trends or patterns are shown. The strength of the plastic product is stable across the 20 subgroups.
|