main topic interpreting results session command see also
A plastic manufacturing company wants to increase the strength of its plastic. The research team identifies additive percentage, agitation rate, and processing time as possible contributors to strength. The temperature at which the batches are baked also impacts plastic strength. They decide to use a split-plot design; all 8 combinations of additive percent, agitation rate and processing time are baked at the same time for each temperature setting. This is repeated so that each temperature level is used twice. This results in 32 observations, run in 4 whole plots of 8 subplots each. The research team has created a split-plot design (see Example of creating a 2-level split-plot design) and collected the strength data. Now they are ready to analyze it.
1 Open the worksheet STRENGTH.MTW. (The design and response data have been saved for you.)
2 Choose Stat > DOE > Factorial > Analyze Factorial Design.
3 In Responses, enter Strength.
4 Click Terms. In Include terms in the model up through order, choose 2. Click OK.
5 Click Graphs. Under Effects Plots, check Pareto, Normal, and Half Normal.
6 In the drop-down, choose Display only model terms, subplot effects only.
7 Click OK in each dialog box.
Session window output
Split-Plot Factorial Regression: Strength versus Temp[HTC], Add, Rate, Time
Analysis of Variance
Source DF Seq SS Contribution Adj SS Adj MS F-Value P-Value Temp[HTC] 1 85.478 11.20% 85.478 85.478 1.52 0.343 WP Error 2 112.391 14.73% 112.391 56.195 5.74 0.011 Add 1 45.363 5.95% 45.363 45.363 4.64 0.044 Rate 1 41.178 5.40% 41.178 41.178 4.21 0.054 Time 1 75.953 9.95% 75.953 75.953 7.76 0.012 Temp[HTC]*Add 1 1.088 0.14% 1.088 1.088 0.11 0.742 Temp[HTC]*Rate 1 78.438 10.28% 78.438 78.438 8.02 0.011 Temp[HTC]*Time 1 62.440 8.18% 62.440 62.440 6.38 0.021 Add*Rate 1 27.938 3.66% 27.938 27.938 2.86 0.107 Add*Time 1 2.940 0.39% 2.940 2.940 0.30 0.590 Rate*Time 1 43.945 5.76% 43.945 43.945 4.49 0.047 SP Error 19 185.858 24.36% 185.858 9.782 Total 31 763.010 100.00%
Model Summary
S R-sq(SP) S(WP) R-sq(WP) 3.12762 67.11% 2.40866 43.20%
Coded Coefficients
Term Effect Coef SE Coef 95% CI T-Value P-Value VIF Constant 62.00 1.33 ( 59.23, 64.78) 46.79 0.000 Temp[HTC] 3.27 1.63 1.33 ( -1.14, 4.41) 1.23 0.343 * Add 2.381 1.191 0.553 (-3.713, -1.399) 2.15 0.044 1.00 Rate 2.269 1.134 0.553 (-1.857, 0.457) 2.05 0.054 1.00 Time 3.081 1.541 0.553 ( 0.033, 2.348) 2.79 0.012 1.00 Temp[HTC]*Add 0.369 0.184 0.553 (-0.023, 2.292) 0.33 0.742 1.00 Temp[HTC]*Rate 3.131 1.566 0.553 ( 0.383, 2.698) 2.83 0.011 1.00 Temp[HTC]*Time 2.794 1.397 0.553 (-0.973, 1.342) 2.53 0.021 1.00 Add*Rate 1.869 0.934 0.553 ( 0.408, 2.723) 1.69 0.107 1.00 Add*Time 0.606 0.303 0.553 ( 0.240, 2.554) 0.55 0.590 1.00 Rate*Time 2.344 1.172 0.553 (-0.223, 2.092) 2.12 0.047 1.00
Regression Equation in Uncoded Units
Strength = 62.003 + 1.634 Temp[HTC] + 1.191 Add + 1.134 Rate + 1.541 Time + 0.184 Temp[HTC] *Add + 1.566 Temp[HTC]*Rate + 1.397 Temp[HTC]*Time + 0.934 Add*Rate + 0.303 Add*Time + 1.172 Rate*Time
Equation averaged over whole plots.
Alias Structure
Factor Name
A Temp[HTC] B Add C Rate D Time
Aliases
I A B C D AB AC AD BC BD CD |
Graph window output
The analysis of variance table gives a summary of the main effects and interactions. Minitab displays both the sequential sums of squares (Seq SS) and adjusted sums of squares (Adj SS). If the model is orthogonal and does not contain covariates, these will be the same.
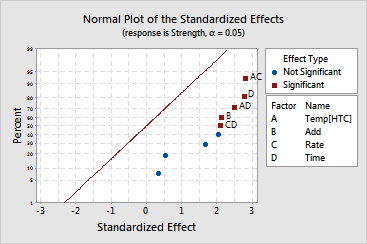
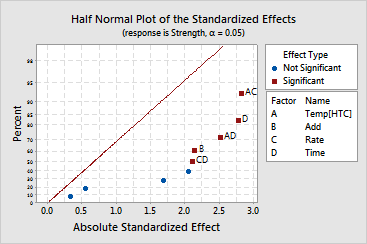
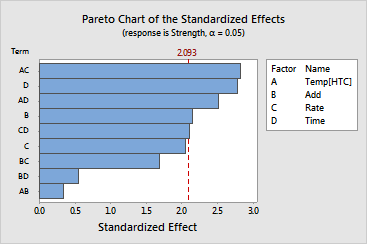
The analysis of variance table and the estimated effects and coefficients table show the p-values associated with each individual model term. The p-values for Add (0.044), Time (0.012), Temp * Rate (0.011), Temp * Time (0.021), and Rate * Time (0.047) are significant at the alpha level of 0.05. Because time is part of two significant interactions, you need to understand the nature of the interactions before you can consider the main effect.
WP Error (whole plot error) is the variance between the whole plots. SP error (subplot error) is the variation between subplots not explained by the factors. The variation between the whole plots is large relative to the subplot variation.
The normal, half normal, and Pareto plots of the effects allow you to visually identify the important effects and compare the relative magnitude of the various effects.
You should also plot the residuals versus the run order to check for any time trends or other nonrandom patterns. Residual plots are found in the Graphs subdialog box. See Residual plots choices.
|
Note |
Minitab cannot compute S(WP) in the following cases: WP Error has zero degrees of freedom, SP Error has zero degrees of freedom, or MSE(WP) - MSE(SP) is a negative value. |