main topic interpreting results session command see also
In the deodorizer example, you fit a model to try to determine how the proportions of the components in an herbal blend deodorizer affect the acceptance of the product based on scent. The three components are neroli oil, rose oil, and tangerine oil. Based on the design points, you mixed ten blends. The response measure (Acceptance) is the mean of five acceptance scores for each of the blends.
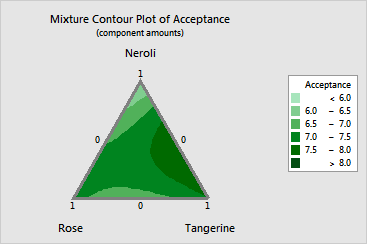
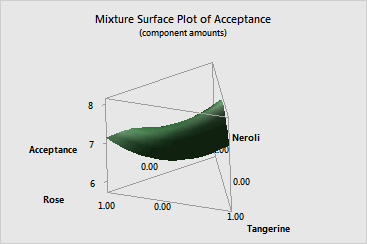
Now you generate a contour and a surface plot to help identify the component proportions that yield the highest acceptance score for the herbal blend.
1 Open the worksheet DEODORIZ2.MTW.
2 Choose Stat > DOE > Mixture > Contour/Surface Plots.
3 Choose Contour plot and click Setup. Click OK.
4 Choose Surface plot and click Setup. Click OK in each dialog box.
Graph window output


The area of the highest acceptance is located on the right edge of the plots. Both the contour and the surface plot show that the acceptance of the herbal deodorizer is highest when the mixture contains little or no rose oil and slightly more tangerine oil than neroli oil.