main topic see also
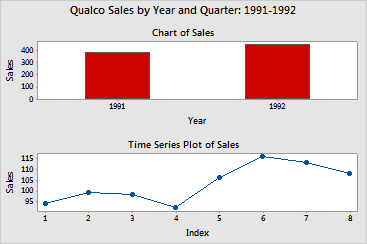
In Example of a two-graph layout you created a layout for a presentation. You want to add a title that describe the entire page in addition to altering one of the individual graphs.
|
Tip |
After you have created a layout, press the [Tab] key to cycle through the selected figure regions. When adding items that are meant to annotate the entire layout rather than a specific graph, be sure that no single figure is selected. |
1 Choose Editor > Add > Title.
2 In Text, enter Qualco Sales by Year and Quarter: 1991-1992 and click OK.
3 Double click any bar in the bar chart.
4 Under Fill Pattern, choose Custom.
5 From
Background color,
choose  and click OK.
Graph window output
