main topic see also
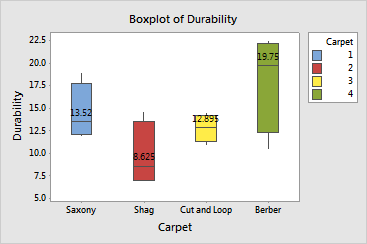
Suppose you have created a graph with a categorical scale containing only one variable level. You decide to make the default categorical scale labels more descriptive. This example assumes you have created the graph in Example of a boxplot with groups.
1 Double-click the x-scale.
2 Click the Labels tab.
3 Under Major Tick Labels, choose Specified and enter Saxony Shag 'Cut and Loop' Berber. Click OK.
Graph window output
