main topic see also
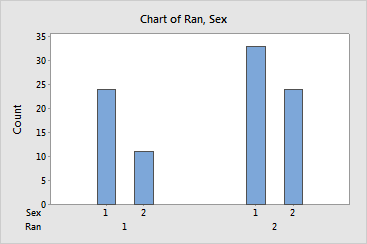
Suppose you have created a graph with a categorical scale. You decide to increase the space between both the scale clusters (Gap between clusters) and the items within the clusters (Gap within clusters).
Step 1: Create the graph
1 Open the worksheet PULSE.MTW.
2 Choose Graph > Bar Chart.
3 Under Bars represent, choose Counts of unique values.
4 Choose Cluster and click OK.
5 In Categorical variables, enter Ran and Sex. Click OK.
Step 2: Edit the scale
1 Double-click the x-scale and click Scale.
2 Under Space between scale categories, in Gap within clusters, enter 1.
3 In Gap between clusters, enter 5.
4 Click OK.
Graph window output
