main topic see also
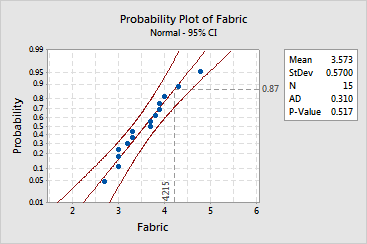
In Example of a probability plot, you created a graph with the default y-scale type, percent. You want to change the scale type to probability.
|
Note |
Similar scale-type editing functions are available for histograms, Empirical CDF graphs, and dendrograms. |
1 Double-click the Percent scale.
2 Click Type.
3 Choose Probability. Click OK.
Graph window output
