main topic session commands see also
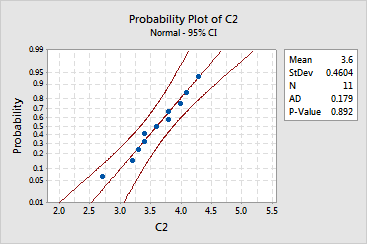
Suppose you are creating a probability plot and decide to alter the default display of the scale from percentages to probability.
1 Open the worksheet FABRIC.MTW.
2 Choose Graph > Probability Plot.
3 Choose Single and click OK.
4 In Variables, enter C2.
5 Click Scale, then click the Y-Scale Type tab.
6 Under Y-Scale Type, choose Probability. Click OK in each dialog box.
Graph window output
