main topic see also
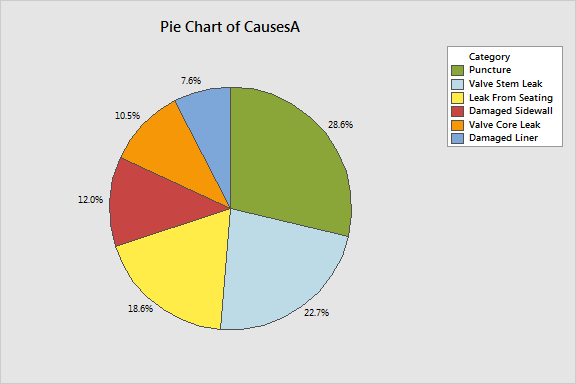
Suppose you created a pie chart displaying the distribution of the most common causes of air loss in tires. After creating the graph, you find more data that should have been included. This example assumes you have created the pie chart found in Example of a pie chart.
Step 1: Update the worksheet
1 In the column Counts, change the value in row 1 to 500. In row 6, change the value to 324.
2 Click outside the cell or click [Enter].
Step 2: Update the graph
1 Click on the graph and choose Editor > Update > Update Graph Now.
Graph window output
