main topic interpreting results session command see also
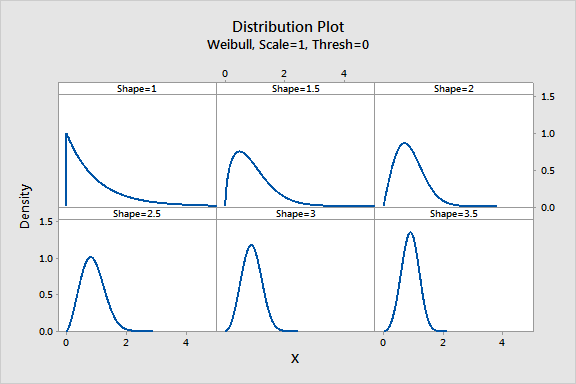
Suppose you are analyzing the rate at which bulbs on a piece of machinery tend to burn out. You think a Weibull distribution might model burn-out times well. Use Probability Distribution Plot and your extensive process knowledge to select a shape parameter.
1 Choose Graph > Probability Distribution Plot.
2 Choose Vary Parameters, then click OK.
3 From Distribution, choose Weibull.
4 In Shape, type 1 1.5 2 2.5 3 3.5.
5 In Scale, type 1.
6 Click Multiple Graphs.
7 Under Show Distributions, choose In separate panels of the same graph.
8 Click OK in each dialog box.
Graph window output

In your experience, burn-outs tend to increase fairly steadily for a time and then taper off slowly. There are always a few bulbs that last longer than expected. In your opinion, this is captured very well by the Weibull distribution with a shape of 2.
| Minitab help | Stat | Graph | SixSigma | DOE | Glossary | Reliability | SPC,MSA,CPK | ||
|
|||||||||