main topics
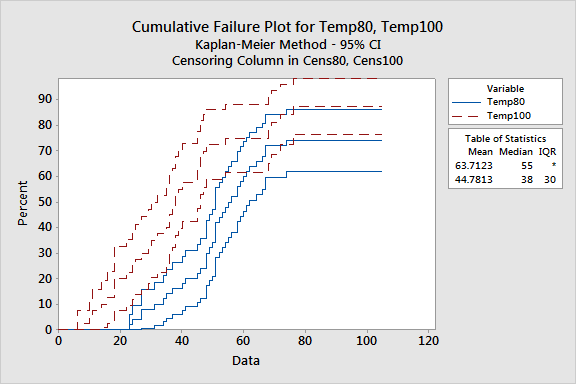
Cumulative failure plots display the cumulative failure probabilities versus time. Each plot point represents the cumulative percentage of units failing at time t. The cumulative failure curve is surrounded by two outer lines - the approximate 95.0% confidence interval for the curve, which provide reasonable values for the "true" cumulative failure function.
You can interpret the nonparametric cumulative failure plot in a similar manner as you would the parametric cumulative failure plot. The major difference is that the nonparametric cumulative failure plot is a step function while the parametric cumulative failure plot is a smoothed function.
