main topic interpreting results session command see also
You are responsible for improving the overall reliability of pressure sensing circuits. Three main components could fail, leading to system failure: sensor, transmitter, and meter. You want to determine which component fails most frequently, so you can redesign it to optimize overall system reliability.
You plan to get this information using Parametric Distribution Analysis (Right Censoring). You can specify a distribution for each failure mode, and Distribution ID Plot (Right Censoring) can help you choose appropriate distributions.
1 Open the worksheet CIRCUIT.MTW.
2 Choose Stat > Reliability/Survival > Distribution Analysis (Right Censoring) > Parametric Distribution Analysis
3 In Variables, enter Weeks.
4 Click FMode.
5 In Use failure mode columns, enter Failure.
6 Under Change Distribution for Levels, type "Meter" in Level and choose Logistic. Click OK.
7 Click Estimate.
8 In Estimate probabilities for these times (values), enter 52. Click OK.
9 Click Results.
10 Check Display analyses for individual failure modes according to display of results. Click OK in each dialog box.
Session window output
Distribution Analysis: Weeks
Variable: Weeks Failure Mode: Failure = Meter
Censoring Information Count Uncensored value 20 Right censored value 60
Estimation Method: Maximum Likelihood
Distribution: Logistic
Parameter Estimates
Standard 95.0% Normal CI Parameter Estimate Error Lower Upper Location 125.102 9.93609 105.627 144.576 Scale 28.2254 4.42553 20.7576 38.3797
Log-Likelihood = -120.771
Goodness-of-Fit Anderson-Darling (adjusted) = 2.807
Characteristics of Distribution
Standard 95.0% Normal CI Estimate Error Lower Upper Mean(MTTF) 125.102 9.93609 105.627 144.576 Standard Deviation 51.1952 8.02702 37.6502 69.6131 Median 125.102 9.93609 105.627 144.576 First Quartile(Q1) 94.0931 8.79250 76.8601 111.326 Third Quartile(Q3) 156.111 12.9391 130.750 181.471 Interquartile Range(IQR) 62.0175 9.72388 45.6092 84.3289
Table of Percentiles
Standard 95.0% Normal CI Percent Percentile Error Lower Upper 1 -4.59716 17.9949 -39.8666 30.6722 2 15.2537 15.3544 -14.8404 45.3479 3 26.9876 13.8859 -0.228249 54.2035 4 35.4001 12.8918 10.1325 60.6676 5 41.9939 12.1560 18.1687 65.8192 6 47.4387 11.5827 24.7370 70.1404 7 52.0916 11.1214 30.2941 73.8891 8 56.1657 10.7419 35.1120 77.2194 9 59.7986 10.4248 39.3663 80.2309 10 63.0843 10.1571 43.1768 82.9919 20 85.9732 8.91686 68.4964 103.450 30 101.187 8.83385 83.8725 118.501 40 113.657 9.23671 95.5538 131.761 50 125.102 9.93609 105.627 144.576 60 136.546 10.8892 115.204 157.889 70 149.017 12.1464 125.211 172.824 80 164.231 13.9004 136.986 191.475 90 187.119 16.8343 154.125 220.114 91 190.405 17.2757 156.545 224.265 92 194.038 17.7685 159.212 228.864 93 198.112 18.3264 162.193 234.031 94 202.765 18.9697 165.585 239.945 95 208.210 19.7302 169.539 246.880 96 214.804 20.6610 174.309 255.298 97 223.216 21.8619 180.368 266.065 98 234.950 23.5580 188.777 281.123 99 254.801 26.4713 202.918 306.684
Table of Survival Probabilities
95.0% Normal CI Time Probability Lower Upper 52 0.930211 0.860212 0.966522
Distribution Analysis: Weeks
Variable: Weeks Failure Mode: Failure = Sensor
Censoring Information Count Uncensored value 30 Right censored value 50
Estimation Method: Maximum Likelihood
Distribution: Weibull
Parameter Estimates
Standard 95.0% Normal CI Parameter Estimate Error Lower Upper Shape 1.94140 0.259879 1.49338 2.52382 Scale 123.794 12.2154 102.025 150.208
Log-Likelihood = -175.507
Goodness-of-Fit Anderson-Darling (adjusted) = 91.130
Characteristics of Distribution
Standard 95.0% Normal CI Estimate Error Lower Upper Mean(MTTF) 109.782 10.9545 90.2804 133.496 Standard Deviation 58.9434 10.6368 41.3837 83.9540 Median 102.497 9.65064 85.2246 123.270 First Quartile(Q1) 65.1613 7.13306 52.5788 80.7549 Third Quartile(Q3) 146.477 15.7691 118.613 180.886 Interquartile Range(IQR) 81.3156 13.6662 58.4949 113.039
Table of Percentiles
Standard 95.0% Normal CI Percent Percentile Error Lower Upper 1 11.5781 3.50015 6.40194 20.9393 2 16.5893 4.26330 10.0248 27.4523 3 20.4962 4.73212 13.0362 32.2253 4 23.8331 5.06684 15.7115 36.1529 5 26.8078 5.32398 18.1641 39.5647 6 29.5270 5.53063 20.4542 42.6242 7 32.0543 5.70200 22.6188 45.4258 8 34.4311 5.84756 24.6824 48.0301 9 36.6862 5.97362 26.6626 50.4783 10 38.8408 6.08463 28.5721 52.8000 20 57.1690 6.82513 45.2417 72.2406 30 72.7912 7.47376 59.5227 89.0174 40 87.5857 8.36169 72.6391 105.608 50 102.497 9.65064 85.2246 123.270 60 118.343 11.4817 97.8499 143.129 70 136.215 14.0674 111.255 166.775 80 158.182 17.8782 126.751 197.407 90 190.228 24.4207 147.911 244.652 91 194.663 25.4027 150.732 251.398 92 199.511 26.4950 153.790 258.825 93 204.876 27.7261 157.144 267.107 94 210.910 29.1375 160.880 276.498 95 217.843 30.7929 165.129 287.385 96 226.056 32.7983 170.104 300.411 97 236.246 35.3502 176.196 316.762 98 249.944 38.8847 184.254 339.052 99 271.853 44.7671 196.862 375.409
Table of Survival Probabilities
95.0% Normal CI Time Probability Lower Upper 52 0.830569 0.739583 0.892040
Distribution Analysis: Weeks
Variable: Weeks Failure Mode: Failure = Transmitter
Censoring Information Count Uncensored value 30 Right censored value 50
Estimation Method: Maximum Likelihood
Distribution: Weibull
Parameter Estimates
Standard 95.0% Normal CI Parameter Estimate Error Lower Upper Shape 1.28261 0.193095 0.954874 1.72282 Scale 144.740 23.8150 104.842 199.821
Log-Likelihood = -183.039
Goodness-of-Fit Anderson-Darling (adjusted) = 182.536
Characteristics of Distribution
Standard 95.0% Normal CI Estimate Error Lower Upper Mean(MTTF) 134.050 24.4633 93.7405 191.693 Standard Deviation 105.314 30.8728 59.2863 187.075 Median 108.764 16.0672 81.4221 145.288 First Quartile(Q1) 54.7928 8.54532 40.3620 74.3831 Third Quartile(Q3) 186.719 34.8668 129.491 269.238 Interquartile Range(IQR) 131.926 32.1199 81.8633 212.604
Table of Percentiles
Standard 95.0% Normal CI Percent Percentile Error Lower Upper 1 4.00834 1.92027 1.56740 10.2506 2 6.90845 2.77412 3.14468 15.1770 3 9.51484 3.39586 4.72722 19.1512 4 11.9552 3.89344 6.31457 22.6343 5 14.2847 4.31101 7.90653 25.8082 6 16.5341 4.67205 9.50292 28.7677 7 18.7226 4.99090 11.1036 31.5698 8 20.8635 5.27720 12.7083 34.2523 9 22.9664 5.53779 14.3168 36.8417 10 25.0385 5.77779 15.9289 39.3576 20 44.9474 7.65582 32.1900 62.7608 30 64.7907 9.55387 48.5285 86.5025 40 85.7314 12.2076 64.8536 113.330 50 108.764 16.0672 81.4221 145.288 60 135.203 21.5834 98.8791 184.872 70 167.279 29.5204 118.366 236.405 80 209.761 41.6423 142.148 309.533 90 277.329 63.7330 176.758 435.121 91 287.173 67.1859 181.552 454.243 92 298.067 71.0679 186.794 475.626 93 310.284 75.4941 192.600 499.875 94 324.219 80.6337 199.133 527.878 95 340.487 86.7490 206.648 561.008 96 360.103 94.2806 215.560 601.568 97 384.957 104.055 226.636 653.876 98 419.239 117.933 241.555 727.625 99 476.098 141.866 265.496 853.756
Table of Survival Probabilities
95.0% Normal CI Time Probability Lower Upper 52 0.764134 0.669288 0.835083
Distribution Analysis: Weeks
Variable: Weeks
Failure Mode: Failure = Meter, Sensor, Transmitter
Censoring Information Count Uncensored value 80
Estimation Method: Maximum Likelihood
Distribution: Logistic, Weibull, Weibull
Table of Percentiles
95.0% Normal CI Percent Percentile Lower Upper 1 -4.59716 -39.8666 6.07378 2 2.84665 -9.59128 8.53978 3 5.22305 1.11119 11.1480 4 7.25491 2.91884 13.5453 5 9.09209 4.45669 15.7178 6 10.7972 5.87296 17.7132 7 12.4045 7.21348 19.5707 8 13.9354 8.49992 21.3189 9 15.4043 9.74470 22.9786 10 16.8218 10.9559 24.5651 20 29.3257 22.0054 38.1040 30 40.3844 32.1542 49.6872 40 50.9837 42.0538 60.6399 50 61.6365 52.0704 71.6014 60 72.7869 62.5445 83.0971 70 85.0170 73.9422 95.7972 80 99.4230 87.1502 110.967 90 119.193 104.718 132.346 91 121.829 107.003 135.255 92 124.686 109.465 138.426 93 127.822 112.150 141.927 94 131.320 115.122 145.858 95 135.305 118.483 150.368 96 139.988 122.397 155.711 97 145.755 127.170 162.351 98 153.459 133.475 171.320 99 165.755 143.393 185.842
Table of Survival Probabilities
95.0% Normal CI Time Probability Lower Upper 52 0.590373 0.499539 0.675433 |
Graph window output


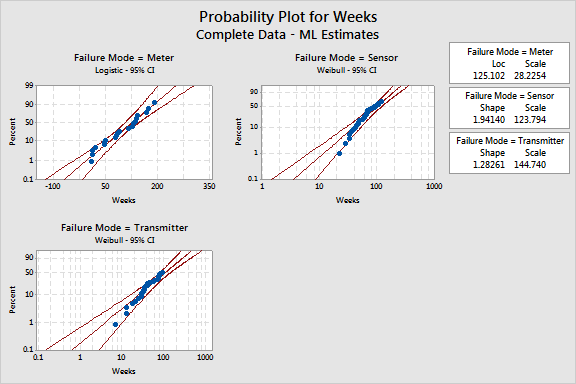
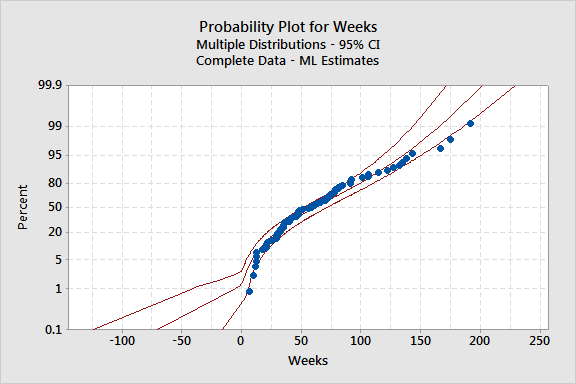
The overall 52-week circuit reliability is 0.590373. That is, 59% of the circuits survive past 52 weeks. You are 95% confident that the true reliability is between 0.499539 and 0.675433.
The 52-week survival probability for each of the components is: meter, 0.930211; sensor, 0.830569; and transmitter, 0.764134. That is, 93%, 83%, and 76% of the meters, sensors, and transmitters respectively survive past 52 weeks.
To improve the overall reliability, you may need to improve both the sensor and the transmitter.