main topic
A scatterplot of the cumulative number of failures at a particular time divided by the time (cumulative failure rate) versus time. Use a Duane plot to:
The fitted line on the Duane plot is the best fitted line when the assumption of the power-law process is valid and the shape and scale are estimated using the least squares method. See Methods and Formulas for the formula for the fitted line.
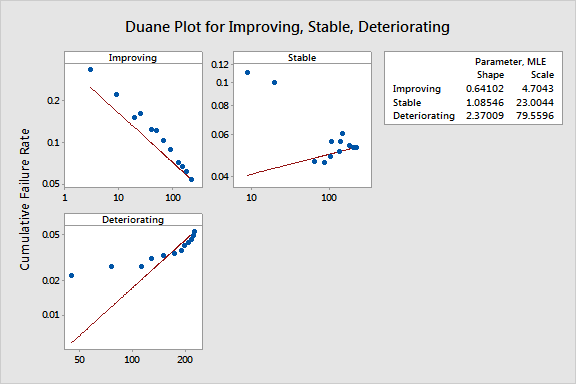
The Duane plot should be roughly linear if the power-law process or homogeneous Poisson process is appropriate. A negative slope shows reliability improvement, a positive slope shows reliability deterioration, and no slope (a horizontal line) shows a stable system.
Below are examples of Duane plots for improving, stable, and deteriorating systems.
