main topic
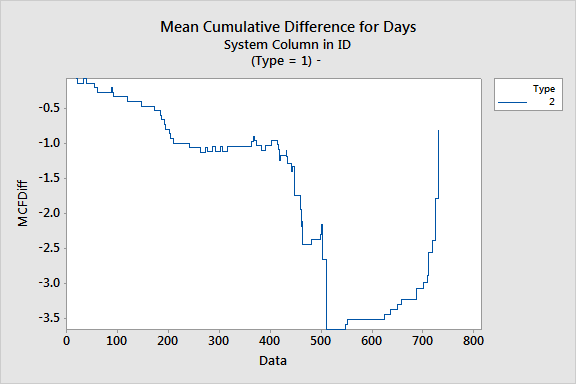
Use the mean cumulative difference function plot to visualize the differences in the mean cumulative function across two or more groups over time. The mean cumulative difference function plot displays the mean cumulative difference function versus time. Minitab places a reference line where the mean cumulative difference function is equal to zero. The plot is a step function with steps at system failures or endpoints of intervals.
This plot is only available when you have one of the following:
Below is an example of a mean cumulative difference function plot.
