main topic
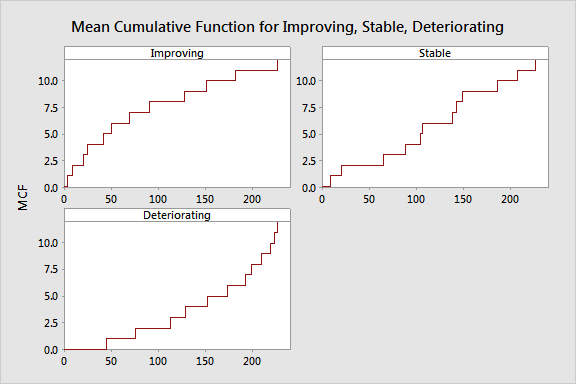
Use the mean cumulative function plot to visualize whether your system reliability is improving, deteriorating, or staying constant. The mean cumulative function plot displays the mean cumulative function versus time. The plot is a step function with steps at system failures or endpoints of intervals.
When you have interval data, Minitab plots the middle point.
The plot provides information about the pattern of system failures:
Below are examples of mean cumulative function plots for improving, stable, and deteriorating systems.
