 Total Time on Test Plot
main topic
Use a total-time-on-test (TTT) plot to visualize how well your model
fits the data. The TTT plot provides a graphical goodness-of-fit test
for the power-law process.
· A
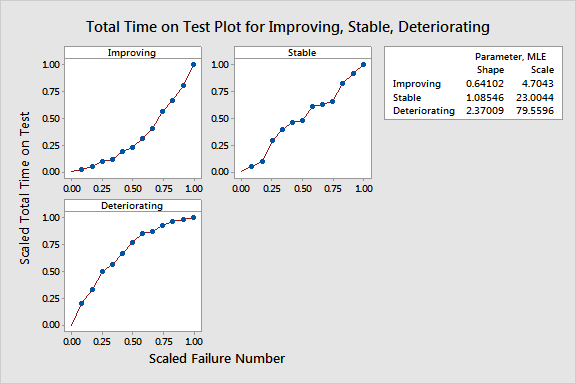
power-law process is appropriate if the TTT plot lies close to the diagonal
or is a curve that is either concave up or concave down
· If
there is no pattern, or a curve that shifts between being concave up and
concave down, the power-law process is inadequate
Below are examples of total time on test plots for improving,
stable, and deteriorating systems.

