main topic
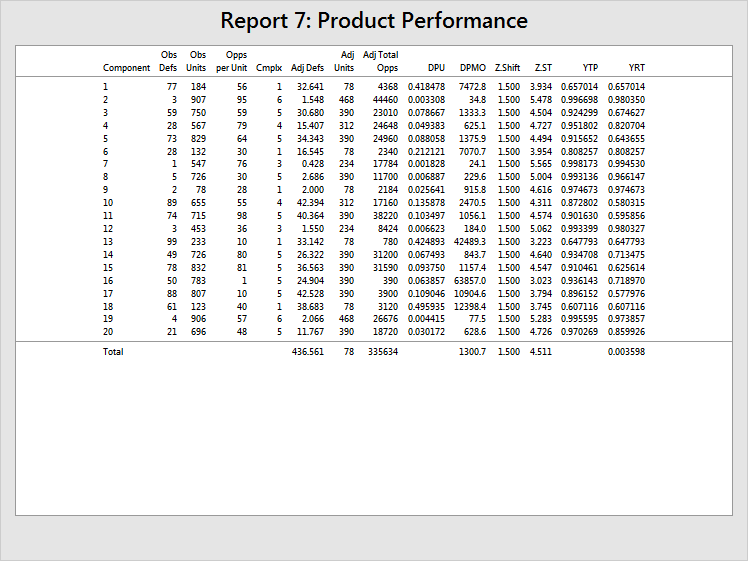
Calculates the rolled up performance measures when combining lower level elements into a higher level unit.

|
Component |
Optional column to provide names for components. If you don't specify names, Minitab assign numbers as IDs by default. |
|
Obs Defs |
Number of defects observed. |
|
Obs Units |
Number of units of each component observed. |
|
Opps per Unit |
Number of opportunities (for defect) per unit. |
|
Cmplx |
Complexity counts for each component. You can adjust the observed units and observed defects by setting proportions for each component. For example, to make a larger assembly, you need 1 unit of component 1, 6 units of component 2, 5 units of component 3, and so on. While the complexity column is not required, it is best to remove any influence of disproportionate sampling. If there are no proportions, enter a column of all 1's. |
|
Adj Defs |
Observed defects are adjusted (or weighted) based on the complexity information. When no complexity units are given, adjusted defects are the same as observed defects. |
|
Adj Units |
Observed units are adjusted (or weighted) based on the complexity information. When no complexity units are given, adjusted units are the same as observed units. All components with the same complexity have the same adjusted units. In the example, components 7 and 12 both have complexity of 3 and adjusted units of 234. |
|
Adj Total Opps |
This column is calculated by multiplying Adj Units and Opps per Unit. If the unit counts were not adjusted, the total opportunities would be skewed in favor of components with larger numbers of observed units, which would affect the calculations of performance statistics. Again, using complexity values reduces the effects of disproportionate sampling. |
|
DPU |
Defects per unit, calculated by dividing the number of defects by the number of units. |
|
DPMO |
Defects per million opportunities, calculated by dividing Adj Units by Adj Tot Opps, then multiplying by 1 million. If the unit counts were not adjusted, the total opportunities would be skewed in favor of components with larger numbers of observed units. |
|
Z.Shift |
Values to represent the assumed long-term sigma shift. If one is not specified, Minitab uses 1.5 as the default. |
|
Z.ST |
Z scores calculated from DPMO and Z.Shift. |
|
YTP |
Throughput yield for each component. This is the probability that none of the opportunities in the component result in a defect. |
|
YRT |
Rolled throughput yield for each component. The probability of having one good unit of component 2 is the YTP, 0.996698. To make a larger assembly, you need 6 units of component 2. The probability of having 6 good units of component 2 is the YRT, (0.996698)6 = 0.980350. |